Question 4#
The ECG changes in the figure below:
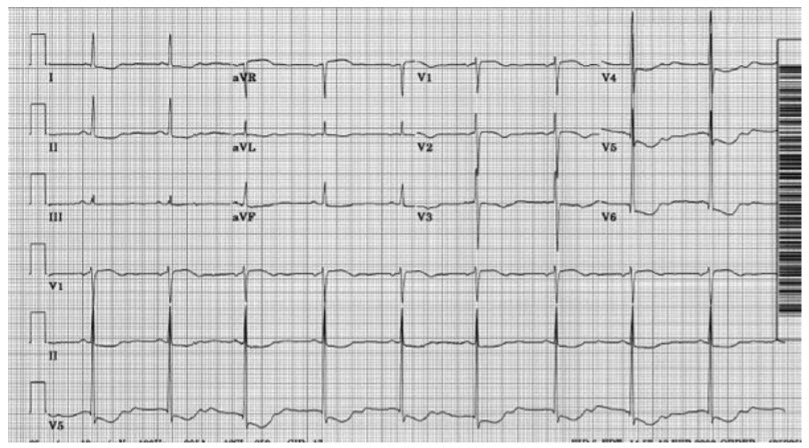
are suggestive of:
A. HypercalcemiaB. Hyperkalemia
C. Hypokalemia
D. Hypocalcemia
E. Digitalis toxicity
Correct Answer is C
Comment:
On this electrocardiogram, there is a sinus rhythm. It is sinus bradycardia. There is a prolongation of the QT interval. In this case, there is ST-segment depression, T-wave flattening, and TU fusion with prominent U waves in the lateral precordial leads. This should suggest hypokalemia. Another possibility is digitalis plus an antiarrhythmic drug’s effects (such as quinidine or procainamide).