Question 31#
THe ECG in the figure below:
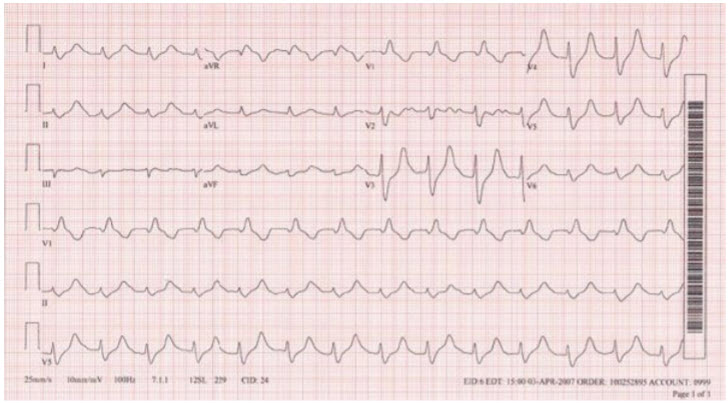
is suggestive of:
A. HypercalcemiaB. Hypocalcemia
C. Digitalis toxicity
D. Hypokalemia
E. Hyperkalemia
Correct Answer is E
Comment:
Hyperkalemia. This shows a sinus rhythm with first-degree AV block, generalized broadening of the QRS (with a right bundle branch block-like pattern), and symmetric broadening of the T wave. This is hyperkalemia. Potassium at the time was 6.2 mEq/L.