Question 33#
The ECG in the figure below:
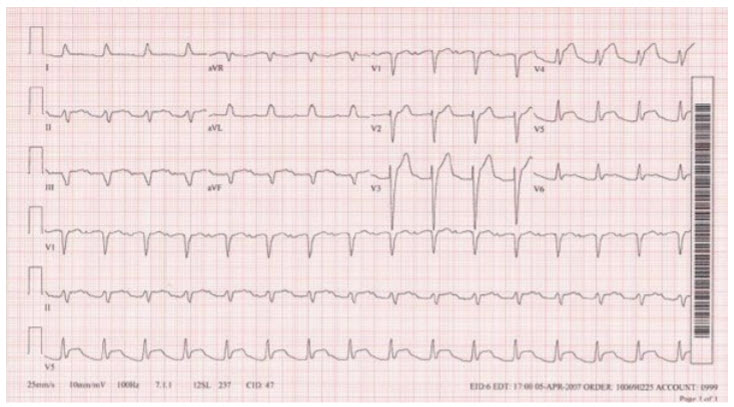
is suggestive of:
A. ST- and/or T-wave changes suggesting acute pericarditisB. ST- and/or T-wave changes suggesting myocardial injury
C. ST- and/or T-wave changes suggesting myocardial ischemia
D. Nonspecific ST- and/or T-wave changes
E. ST-T segment changes secondary to intraventricular conduction distribution or hypertrophy
Correct Answer is A
Comment:
ST- and/or T-wave changes suggesting acute pericarditis. Rhythm is sinus with a first-degree AV block. There was a wide complex without septal Q waves in leads I and V6 (a left bundle branch block pattern) and left axis deviation. ST and T waves are “discordant” in the anterolateral leads (and also generally). There is also PR-segment elevation in lead aVR. This could be anterior “injury,” but more suggests acute pericarditis.