Question 35#
The ECG in the figure below:
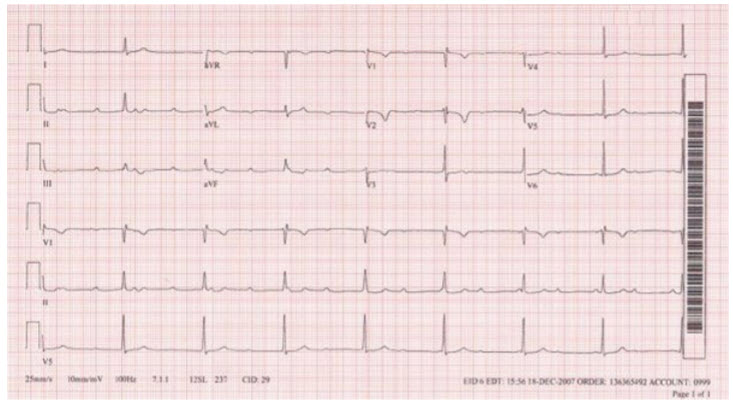
shows:
A. Nonspecific ST- and/or T-wave changes + Right bundle branch block (RBBB), incomplete + AV block, complete + Sinus tachycardiaB. Nonspecific ST- and/or T-wave changes + Right bundle branch block (RBBB), incomplete + AV block, complete
C. Right bundle branch block (RBBB), incomplete + AV block, complete + Sinus tachycardia
D. Nonspecific ST- and/or T-wave changes + AV block, complete + Sinus tachycardia
E. Nonspecific ST- and/or T-wave changes + Right bundle branch block (RBBB), incomplete + Sinus tachycardia
Correct Answer is A
Comment:
Nonspecific ST- and/or T-wave changes + Right bundle branch block (RBBB), incomplete + AV block, complete + Sinus tachycardia . A sinus rhythm with AV dissociation (complete heart block) and junctional escape. V1 shows an incomplete right bundle branch block pattern. T waves are not entirely normal in V3 .